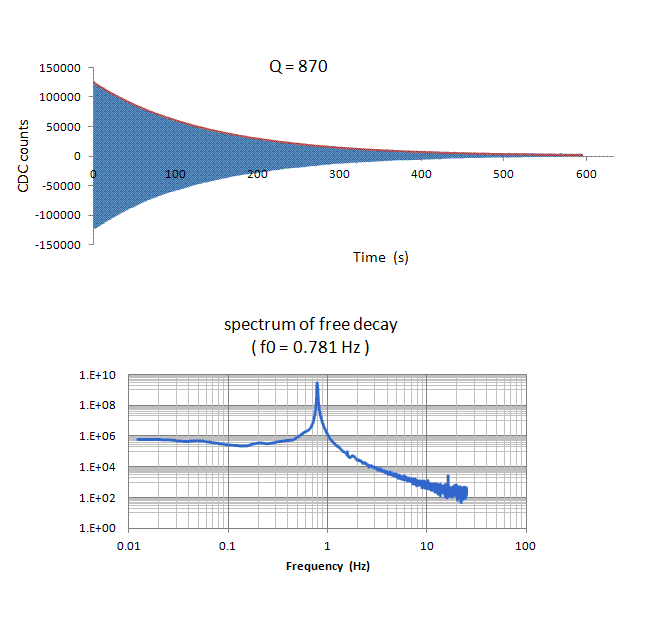
Figure 1. Example free decay of the pendulum.
05.1100
Randall D. Peters and Eric Daine
Copyright Aug 2012
Abstract
Described is a close variant [1] of the pendulum that spawned the VolksMeter and which collected the data reported by the article ``Building on old foundations with new technologies" [2]. At that time it was configured with an upper mass for tuning to the characteristic period of microseisms. As such, the instrument still existed in its original form, designed to monitor hurricanes [3]. Operating now with our new digital package that replaced the earlier analog electronics, the pendulum has been further altered to function without the upper lead mass. For the present article, records were collected over a time period of roughly three days. During that time there was a large earthquake near Russia, with a magnitude greater than 7. Careful analyses of those records, in both the time and frequency domains, suggest that our novel instrument has significant potential for improved understanding of the low frequency dynamics of our planet. When the present experiment is considered in light of a recent theory of catastrophes [4], there is increased hope for the eventual possibility of life-saving earthquake early warning predictions.
Background
In the past 25 years, Randall Peters [5] has devoted most of his physics career to the study of chaos and complexity in mechanical systems. His efforts have been greatly facilitated by the fully differential capacitive sensors that he invented [6]. The advent of an award winning digital electronics support for the sensors (Analog Devices' capacitance to digital converter chip, the AD7745) has opened a wealth of new possibilities. The first instrument to take advantage of the change was the VolksMeter (VM), which is a state-of-the-art seismograph [7]. Recently Eric Daine developed a user-friendly, compact package that is readily adaptable for use with a multitude of different systems, some examples of which have been posted to our webpage [8]. The pendulum described in this article was not considered for such a change in our earliest plans, for reason of software issues. To analyze the long-time records in which we are interested, stored in the computer at a sample collection rate of 50 Hz, is a daunting task without packages such as WinSDR/Winquake. Written by Larry Cochrane, who runs a popular public seismic network, WinSDR is a convenient seismic data recorder that generates a windows `helicord display' of output data from the VM. [The term `helicord' is used here to describe Cochrane's computer generated display that is similar in appearance to the old drum type recorder ink traces that were common during the time of the `world wide standardized seismic network` (wwssn).] WinQuake can be employed to look at a `close-up' of any small piece of the 24-one-hour segments typically displayed as WinSDR accumulates daily records. Lacking such powerful software as part of our electronics/computer, the present project was placed in reserve. But change became possible as the result of increased familiarity with Mathematica. The software created by Stephen Wolfram is not only capable of dealing with the large files being generated, but it also provides exceptionally powerful tools for their frequency domain analysis. The figures presented in this article were generated by using Mathematica in concert with Microsoft's Excel.
Pendulums and Seismology
Although it is best known for attention given to it by physicists, the gravitational (`simple') pendulum was one of the first truly significant seismometers. As time progressed, it fell from its place of favor, and gave way to instruments that seismologists call `pendulums', but which might be more accurately labeled with a different name. Peters has studied many `pendulum' types in the last 1/4 century, and he came to quickly realize that the instrument first studied scientifically by Galileo and Newton should not be considered a relic. Two of his early publications, from work that started in the late 1980's, were part of his participation in the first International Pendulum Project in Sydney Australia [9]. Those studies gave rise naturally to his decision to become involved in seismic research, with his most significant refereed journal publication to date being an invited tutorial [10].
Instrument `benchmarking'
Some examples of the present pendulum's characteristics and performance capabilities are now provided.
Figure 1 shows a free decay in which the instrument sat on the concrete slab basement floor of the first author's house, located in the Appalachian foot-hills of Georgia, USA.

Figure 1. Example free decay of the pendulum.
Its quality factor of 870 was obtained by trial and error fit of an exponential to the upper turning points of the motion (visible line colored red, computed with Excel). Determination of the pendulum's characteristic frequency of 0.781 Hz was by means of the Fast Fourier Transform (FFT) of the record (tool named `Fourier analysis' in Excel-requiring installation of the analysis `tool-pak'). Dynamic range and Linearity of the sensor, involving a four-piece electrode array attached to the bottom of the pendulum (similar to the picture in Fig. 5 of ref. [1]) can be inferred from the spectrum of Fig. 1 to be outstanding.
To initialize the motion by means of periodic tilt, the pendulum was driven at resonance by timely deformation of the floor via the shifting of body weight back and forth between two points about 0.5 m and 1. m away from the instrument.
All other data used in the presentation of this article were from recordings involving minimal disturbance to the basement floor as the result of human (or animal) activity. To eliminate the effect of otherwise significant and inevitable tilts of the pendulum that occurred when the computer was started and stopped (a total of 32 times for the 16 records studied), the beginning and ending parts of each record were discarded. Typically, these amounted to 20,000 points (6.7 min) at the start and 1000 points (20 s) at the end of each record.
Involving intervals greater than one hour, every record showed a significant secular variation. If this study were concerned with spectral features as low in frequency as micro-Hz, recording times would be much longer and a primary cause for the secular trend would be considered; i.e. crustal tide effects and diurnal influence of temperature change at the surface of the earth. Being here concerned with frequencies a thousand times higher than that, the secular change was thus removed from each record before performing the calulation of the FFT.
Signal to noise ratio
As measured from a consideration of records such as the one used to generate Fig 2 by means of Excel, the SNR of the instrument is quite adequate for present purposes.
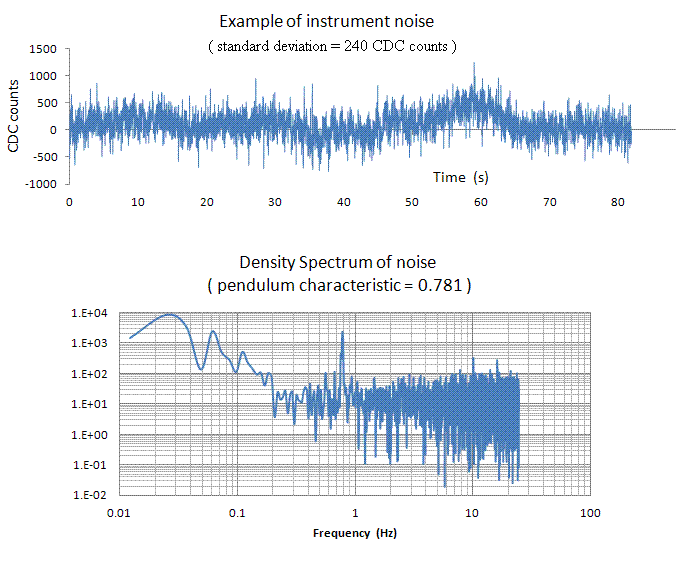
Figure 2. A recording of`Quiet' time pendulum output used to quantify
instrument noise.
A substantial portion of the 240 capacitance to digital converter (CDC) counts of noise indicated in the figure are clearly of basement floor mechanical origin. This is deduced from the presence of the spectral line at 0.781 Hz, corresponding to the pendulum's characteristic frequency; which is well above the noise floor seen in the figure for frequencies above 1 Hz. That floor is expected to be of electronics origin, and other of our experiments have measured it to be of the order of 100 counts. It is limited by the quality of onboard filtering used to suppress USB voltage fluctuations that are present in the power supplied to the board by the computer. Seen from the figure to be `white' (above 1 Hz) the electronics noise floor is thus no doubt significantly influenced by discretization errors that derive from the conversion dynamics of the AD7745 MEMS chip.
Dynamic Range
No efforts were made to presently measure the sensor's dynamic range, which greatly exceeds the minimum required for the present study. Other experiments involving similar sensors have shown it to be typically in excess of 100 dB.
Unorthodox features
Externally forced damping of instruments is the modus operandus of conventional seismology. To operate otherwise is completely unacceptable to the professionals of that world. Their ideal system is chosen to function with Q = 0.707, which is near the critical damping value of one-half. That practice derives from the usual concern for real-time visual inspection of earthquake records. The transient response of an undamped instrument seriously hampers one's ability to render an immediate and meaningful visual interpretaton of what is seen on the monitor. Nevertheless, we have consistently demonstrated that the low-frequency features of a record are not adversely influenced by the transient response of a high-Q pendulum-as long as the accelerations that drive the instrument do not exceed thresholds much higher than anything that has been seen in the present study. Moreover, the higher frequency noises of the environment serve (in the case of a high Q instrument) to mitigate against internal friction effects that become ever more significant at the lowest frequencies of interest. (Extensive studies of `low and slow' pendulums have documented the importance to seismology of internal friction phenomena that remain poorly understood and which limit instrument performance [11]). Regardless of a given personal opinion on the matter, by assuming linearity of the system one can always remove the transient instrument response through deconvolution. Thus for this study, no attempt was made to provide external damping. On the other hand, the VolksMeter that was created by Peters was designed to operate with damping. The damping results from eddy currents through the use of rare earth magnets.
Earthquake and an unusual precursor that was observed
As mentioned in the abstract, an earthquake of greater than M7 occurred during the course of data collection over approximately three days. A portion of the record (no. 6 out of 17) in which this happened is shown in Fig. 3.
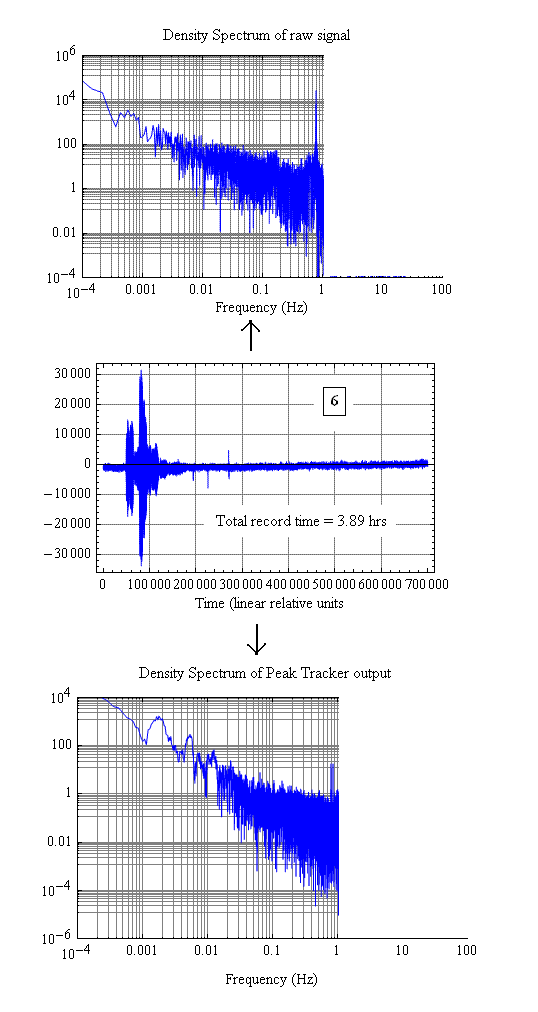
Figure 3. A portion of record 6 of the present study showing the
earthquake. By means of Peak Tracker demodulation of the raw signal [12],
free oscillations of the Earth have been made visible in the density spectrum.
The spectral lines of these eigenmode oscillations triggered by the earthquake
are not visible in the raw spectrum.
Components of the spectrum from 1 Hz to the Nyquist frequency of 25 Hz are not provided in this figure for the following reason. As seen in Fig. 2, the system noise for that range is determined largely by electronics (discretization; i.e., white) noise. Correction of the spectrum through application of the pendulum's known transfer characteristic thus implies an unrealistic increase with frequency of seismic power.
Earthquakes and modulation effects
Two years ago, on the basis of fundamental physics involving nonlinearity (Peters specialty), it was hypothesized that eigenmode oscillations of the Earth should modulate high(er) frequency vibrations of our planet. Evidence for this novel view began to appear in earthquake data collected with the VolksMeter that resides in the seismic lab of the Physics Department of Mercer University [13]. Validity for the claim is further substantiated by Figure 3, through the clear difference between the two density spectra shown.
A recent publication also points out that the physics responsible for the modulation (antipodal effect) became widely known in 1957 [14]; i.e.,
"The idea of antipodes was known since antiquity, but the antipodal effect as a wave phenomenon became widely known only in 1957 after launching Sputnik by the Soviet Union. Millions of radio amateurs were receiving and listening the satellite signal. The amplification of the signal during the passage of satellite the neighborhood of antipodal point of the trajectory caused a special interest and widespread enthusiasm [Alpert, 1961]. It is clear that the propagation of surface seismic waves excited by an earthquake leads to a similar effect."
The eigenmode oscillations made visible following demodulation are too small to be seen otherwise. No doubt, however, sophisticated instruments such as superconducting gravimeters are able to see them without resorting to demodulation. Such instruments were cause for the great interest that developed in persistent `hum' of the earth, beginning about 1998. Such interest has soared to new heights more recently, and considerable efforts have been devoted to try and understand its origin [15]. The first experiments to see oscillations of remarkably similar type, and happening on a persistent basis were conducted in the early 1990's. The oscillations were discussed in a paper published in 1995 [16]. Now 17 years later that paper remains mostly (if not completely) unknown to scientists other than the ones who authored it.
Earthquake precursor
Shown in Fig. 4 is the first of the total of 17 records that were saved for this study.
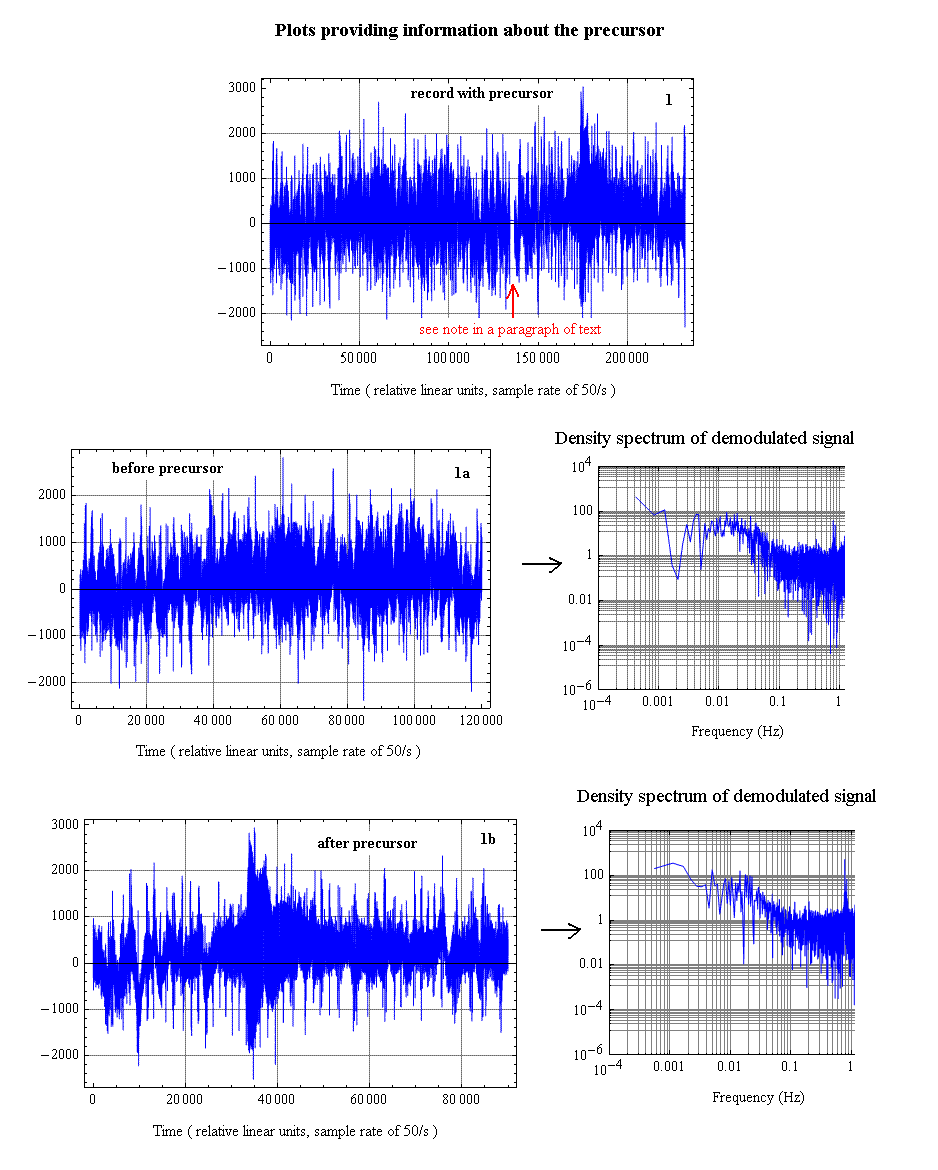
Figure 4. An 83 min record (top graph) in which there was a notable
short-lived event that happened approximately 12 hours before the M7 earthquake.
The red arrow points to a segment where a large and sharp event happened prior to the earthquake. Because of initial noise problems that were encountered in getting the system operational, this event (which was roughly 50 times larger than the rest of the signal, was assumed to be an electronics artifact. Rather than discard the entire record as analysis was being considered-instead, in all the places where it was obvious, the numbers there were manually replaced with the number corresponding to the record's overall mean value. After seeing the earthquake that happened about 12 hrs later (observed in a follow-on recording, before checking a USGS site to obtain information about it), the choice to eliminate that part of the record became cause for great regret. With a view toward nevertheless salvaging anything of value following the tragedy, a much larger than usual number of Mathematica calculations have subsequently been performed. Only a small fraction of the total number that have been done are represented by the spectral plots of Fig. 4. The most striking thing to note from these is the following. No matter the particular nature of the event that was discarded, something very unusual happened before its occurrence (and it was itself also probably shortlived, but there is no data before record 1 to know for sure). There was a pre-precursor, in the form of a significant loss in seismic power corresponding to oscillations in the neighborhood of 2 mHz (period of 500 s).
In the event that earth behavior like this might be fairly common while not yet known, some considerations for the prerequisites for its discovery were considered. First of all, one must recognize, as demonstrated by the details of Fig. 5, the need for an adequately high sample collection rate.
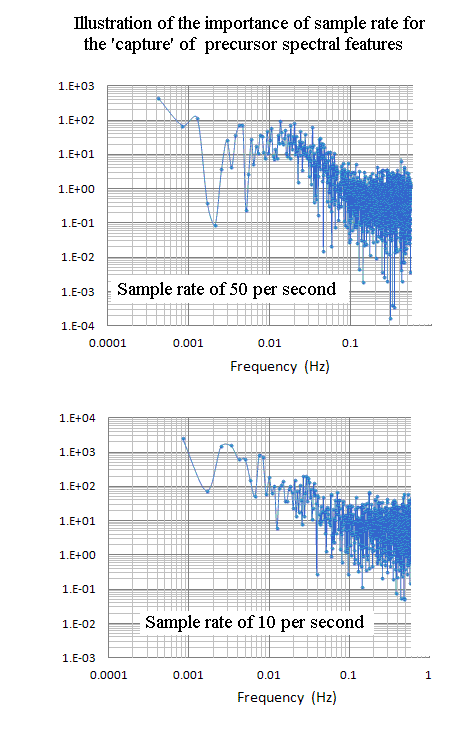
Figure 5. Illustration of a frequency resolution challenge as sample
collection rate should get too small. Only the lower frequency range for
each case is shown.
To see a short lived precursor in the time domain, the data rate must obviously be high enough to provide a reasonable approximation to its actual shape. Similar constraints determine whether it is visible in the frequency domain, as seen from Fig. 5. The number of points per octave in these log graphs decreases by a factor of two for every decrease of the frequency by a factor of two. At the rate of 10 samples per s (lower graph, Nyquist frequency of 5 Hz), only one point defines the drop in power at 2 mHz; whereas at the higher rate of 50 sps, much more spectral detail is visible, not just in the vicinity of 2 mHz, but throughout the entire spectrum. The Nyquist frequency is usually pondered only in relationship to how it limits the highest observable frequencies (and also addresses concern for the elimination of aliases). Here we see that the influence of one's choice for the Nyquist frequency can have greater consequence than generally recognized.
To reduce the burden of working with large files that result from long recording times, sample rates are generally set toward lower values. These plots show the need for more care in the choice of data rate than one might naively assume.
Still another factor should be noted, when it comes to studies of this type. The prevailing modus operandus of seismograph output is one that is traditionally labeled `velocity', with units of m/s. The wwssn instruments used a Faraday law detector in which the output signal was one corresponding to the derivative of the signal that is output from our instrument. The falloff in sensitivity below the characteristic frequency for this `velocity' sensor causes it to be ever less sensitive to earth motion as the frequency decreases. Conversely, the sensitivity of our `displacement' sensor remains constant as the frequency decreases. Such loss of sensitivity is an important additional factor to explain why such precursors have not (apparently) before now been studied, assuming they are indeed fairly common. It is worthy of note that the `velocity' sensor actually measures ground velocity for frequencies higher than the characteristic. But below the characteristic frequency it is a `jerk' detector, where jerk is defined as the derivative of acceleration.
12 and 24 hr Periodic features
It was noted above that the precursor occurred 12 hours before the earthquake. Calculated values of the standard deviation of the temporal records also show surprising cyclic variations, as seen in Fig. 6.
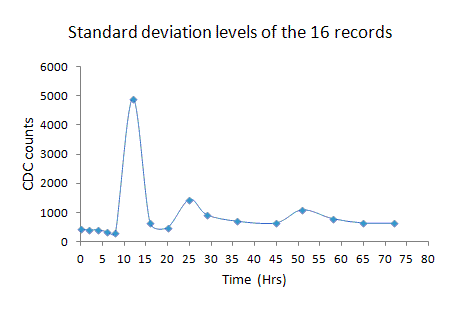
Figure 6. Time plot showing 12 and 24 hour periodicities in the standard
deviation about the mean of the 16 detrended temporal records.
Several striking features of Fig. 6 deserve mention. First, notice the systematic decline before the large increase that occurred at the time of the earthquake. Recovery toward smaller seismic powers follows the earthquake, but with interruptions to that trend, first 12 hrs after the event and then again 36 hrs after the event. It is logical then to conclude that the crustal tidal force has played a central role.
Conclusion
If the findings reported in [4] apply to earthquakes, then the most important feature of the `signal' that `an earthquake is coming' would be a `slowing down' that becomes visible in the information provided by frequency domain analyses. The dip at 2 mHz seen in Fig. 4 is evidently consistent with this expectation. Additionally, the trend seen in Fig. 5 just before the earthquake; i.e., a decline of seismic power corresponding to a `calm before the storm', is also consistent with that expectation. Additional numerous experiments are called for, to determine if what has been here seen occurs on a regular basis. Questions to be answered in the event such behavior is indeed observed are: Is the behavior common to earthquakes in general, or as in the present case, only to large earthquakes in particular.
References
[1]
http://arxiv.org/html/physics/0508028v1
[2] First chapter of ``Science education in the 21st century'', online
description of the book at
https://www.novapublishers.com/catalog/product_info.php?products_id=6018
[3] R. Peters, ``Compound pendulum to monitor hurricanes and tropical storms'',
online at
/peters_rd/compound/compound.html
[4] Randall D. Peters, Martine Le Berre, & Yves Pomeau, ``Prediction
of catastrophes: an experimental model'', accepted for publication by Physical
Review E (Aug 2012). An online preliminary version of the paper is available
at
http://arxiv.org/abs/1204.1551
[5] Professor Emeritus, Department of Physics, Mercer University, Macon,
Georgia USA.
[6] His first sensor, the LRDCT
http://www.google.com/patents/US5028875
was the first capacitive sensor of ``fully differential'' type. Its name
was purposely selected to draw attention to the (then) widely used engineering
sensor of magnetic type, labeled LVDT. A topological variant of the LRDCT
became the most versatile of these transducer types
http://www.google.com/patents/US5461319
It was the basis for a third patent that is concerned with nano-device
positioning
http://www.freepatentsonline.com/8081005.html
[7]. psn.quake.net/volksmeter/State-of-the-art_Digital_Seismograph.pdf
[8] http://symcdc.com
[9] International Pendulum Project, Sydney, Australia, 16-19 October 2002:
(i) "The Pendulum in the 21st Century-relic or trendsetter?
http://arxiv.org/html/physics/0207001/,
and (ii) 'Soup-can Pendulum
/peters_rd/petepag/soupcan.html
[10] ``Tutorial on gravitational pendulum theory applied to seismic sensing
of translation and rotation'', Bulletin of the Seismological Society of America,
May 2009
http://www.bssaonline.org/content/99/2B/1050
complete article online at
/peters_rd/BSSA-tutorial/pend-theory.pdf
[11] R. Peters, ``Friction at the mesoscale'', Contemporary Physics, Vol.
45, NO. 6, pp 475-490 (2004)
http://www.ingentaconnect.com/content/tandf/tcph/2004/00000045/00000006/art00002
Another paper that speaks to internal friction physics of related type is
R. Peters, ``Study of friction at the mesoscale using Nitinol Shape Memory
Alloys'', online at
http://arxiv.org/html/physics/0308077
[12] R. Peters, ``Signal peak-tracker based on the Teager Kaiser energy (TKE)
operator''
http://arxiv.org/ftp/arxiv/papers/1010/1010.5166.pdf
[13] R. Peters, ``Amplitude Modulation effects in seismic signals'', online
at
/peters_rd/modulation/modulation.html
[14] A. Guglielmi & O. Zotov, ``Impact of the earth's oscillations on
the earthquakes'', online at
arxiv.org/pdf/1207.0365
[15] c.f. the work of Barbara Romaniwicz, described online at
http://seismo.berkeley.edu/annual_report/ar04_05/node251.html
[16] M. H. Kwon & R. Peters, ``The study of eigenmode types and source
nonlinearity in the free earth oscillations'', Saemulli Vol. 35, no. 4, 569
(1995).
The material for this article was taken from the 1990 PhD dissertation of
M. H. Kwon, titled
``Refinements of a new balance for measuring small force changes"