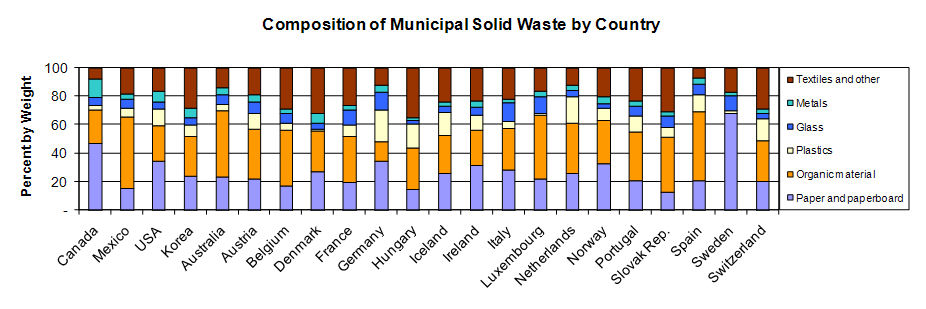
What is waste composition like in other Countries?
 |
Objectives:
Goals:
Assignments:
Resource Conservation and Recovery Act (RCRA)
RCRA-C vs. RCRA-D
Both RCRA-C and RCRA-D regulate only solid wastes (SW).
RCRA-C regulates only HAZARDOUS solid wastes while RCRA-D regulates only non-hazardous solid wastes.
Municipal (non-hazardous) solid waste is effectively any solid waste that is not a hazardous solid waste so, it is important to know a little bit about hazardous waste.
Review: The USEPA's Hazardous Waste Page
- Surf a few links of down on a few topics and make notes on topics/information that sparks your interest.
Skim: EPA's Learn the Basics of Hazardous Waste Page
Skim: EPA's Hazardous Waste Generators Page
Skim: EPA's Hazardous Waste Transporters Page
Skim: EPA's Hazardous Waste Manifest System Page
Skim: EPA's Introduction to (Hazardous Waste) Treatment, Storage, and Disposal Facilities Document
Review: Chapter III of RCRA Orientation Manual 2014 (EPA530-F-11-003 October 2014) (PDF Document)
Review: US EPA's Cradle-to-Grave Hazardous Waste Management Program Page
Hazardous wastes are
- Materials specifically LISTED by EPA
- F-List, K-List, P-List, and U-List
- Material that meet hazardous waste physical properties CHARACTERISTICs
- Toxicity, Reactivity, Ignitability, and Corrosivity
- Materials DECLARED hazardous by the generator
What types of materials are RCRA-D wastes (non-hazardous solid wastes)?
What is Municipal Solid Waste (MSW)?
What are the sources of RCRA subtitle-D Wastes?
- Organic
- Inorganic
- Putrescible
- Combustible
- Recyclable
- Hazardous - regulated under 40 CFR 261 Subtitle C
- Regulatory Defn: SW which because of its quantity, concentration, physical, chemical, or infectious character, may cause or significantly contribute to an increase in mortality or an increase in serious, irreversible or incapacitating reversible illness or may pose a substantial present or potential hazard to human health or the environment when improperly transported, disposed of, stored, treated, or otherwise managed.
- Infectious
- Disposable equipment, instruments, utensils, or fomites from rooms of patients who have been diagnosed or are suspected of having a communicable disease, laboratory wastes laboratory wastes such as tissues , blood specimens, excreta, and secretions from patients or lab animals, disposable fomites, and surgical op room pathological specimens, fomites and other materials from outpatient areas and emergency rooms
- Federal mandates required the States to develop and enforce acceptable regulations
COMPOSITION STUDIES
What is waste composition like in other Countries?
What is waste composition like in the U.S.?
Source Data: US EPA Municipal Solid Waste Generation, Recycling, and Disposal in the United States: Facts and Figures for 2014
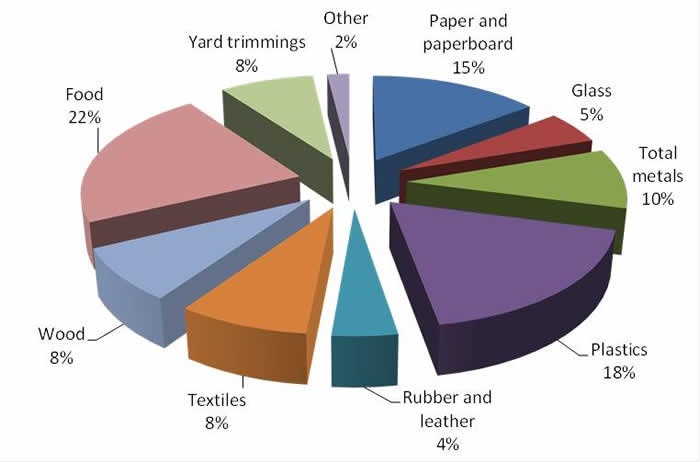
Composition of Waste Generated (before recycling) in the U.S. in 2014
2014 U.S. Total Waste Generation 258.5 million tons
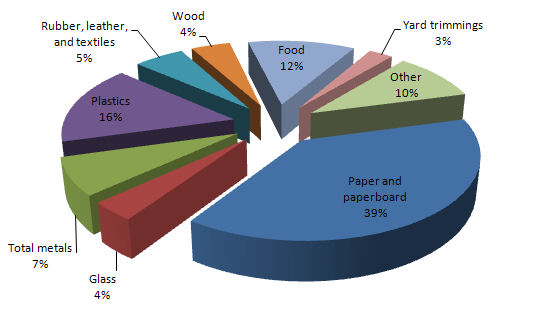
Composition of Waste Disposed (after recycling) in the U.S. in 2014
2014 U.S. Total Waste Disposal 169.1 million tons
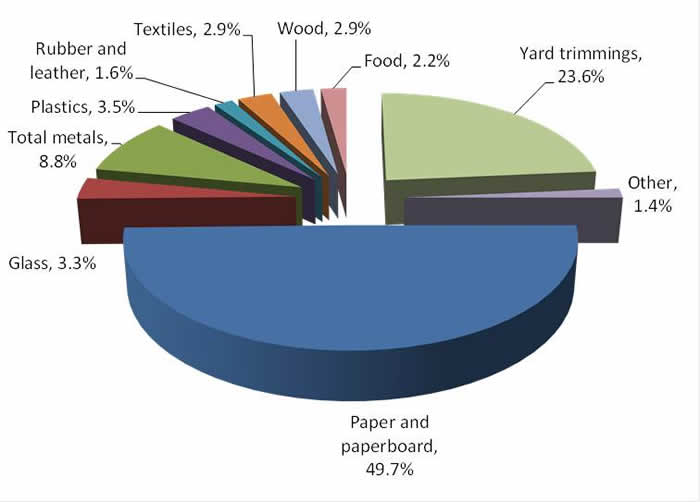
Composition of Recyling Stream in the U.S. in 2014
2014 U.S. Total Waste Recycled 89.4 million tons
Think: Based on the data in the three pie-chart figures above, what was the overall recycling rate in the U.S. in 2014?
Think: The three pie chart figures above were created using the data presented below. How was this done?
US EPA MSW Generation, Recycling, and Disposal in the United States: Facts and Figures for 2006
Table 1. Generation and Recovery of Materials in MSW, 2006
Material Weight Generated
(tons/1000)
Weight Recovered
(millions of tons)
Recovery
(% of Generation)
68,610
44,400 64.7 11,480 2,990 26.0 17,690 5,840 33.0 3.530 700 19.8 2,040 1,360 66.7 23,260 7,900 34.0 33,250 3,170 9.5 8,210 1,440 17.5 16,220 2,620 16.2 16,120 2,570 15.9 4,440 1,290 29.1 181,590 66,380 36.6 38,400 1,940 5.1 34,500 21,080 61.1 Misc. inorganic wastes
3,970 negligible negligible Total other wastes
76,870 23,020 29.9 258,460 89,400 34.6 Includes waste from residential, commercial, and institutional sources.
Details may not add to totals due to rounding.
Negligible = Less than 5,000 tons or 0.05 percent.
* Includes lead from lead-acid batteries.
** Includes recovery of other MSW organics for composting.
What is waste composition like in Georgia?
Composition of Waste Disposed in Georgia in 2004
2004 Georgia Total Waste Disposal 15.8 million tons
Think: How could the data in the USEPA Table on U.S. Waste Composition be used with the Georgia Disposed Waste Compostion Pie-Chart to predict the composition of the waste generated in Georgia? What assumptions would be necessary?
TERMINOLOGY:
Important
EXAMPLE PROBLEM:
THINK:
Rework the above problem using the following information: 80% of the homes have food grinders in which they grind 40% of their food waste. The overall recycling efficiency is 20% (not 11%). The composition of the disposed and recycled waste streams remains the same. Here is the answer.