

| Sensitivity Analysis - Objective Coefficient | Previous | Next |
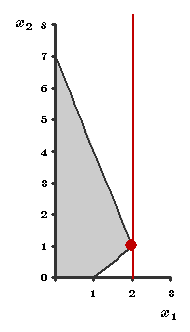
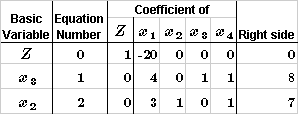
Original Final Tableau:
 |
 |
|
New Final Tableau:
 |
||
| What is the range of optimality for |
||
| This concludes the demonstration. See the OR Tutor menu (to the left) for other demonstrations or close the browser window to exit OR Tutor. | ||