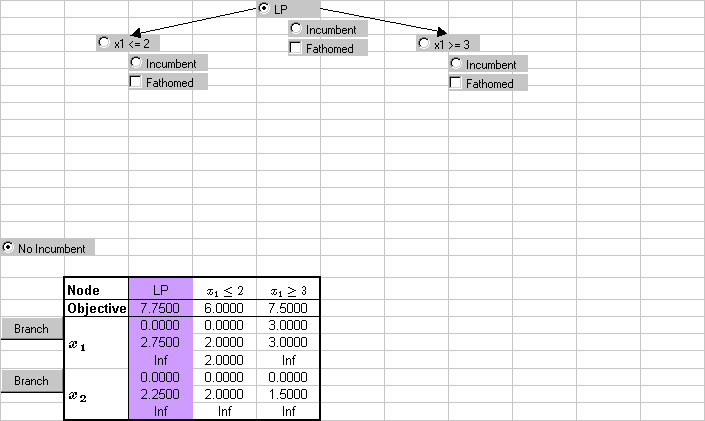
| Shown above is a summary of the situation after the two
subproblems have been solved. The top of the tree represents the LP-relaxation
of the whole MIP problem. It is the currently selected node. Also shown
are the consequent branching variable and the new constraint added for
each of the subproblems (represented by the two lower nodes). The table
depicts the lower and upper bounds, and the optimal value for each variable at each node.
For each variable, the top number is the lower bound, the middle number the optimal value, and the bottom number the upper bound. |

