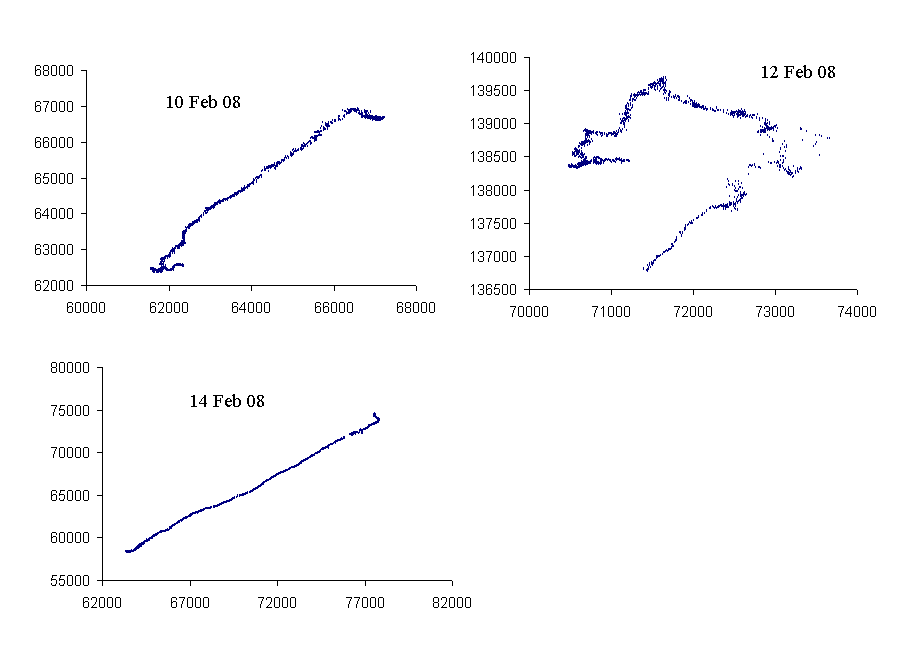
Figure 1. Correlation plots that demonstrate periodic strain in the earth.
Background
The vast majority of seismic measurements are based in time derivatives. For example, the `ideal' response of a common force-balance, broadband seismograph is one that is `flat to velocity'over a broad frequency range. What these instruments generate at their output is a signal that is proportional to the time derivative of the inertial mass position relative to the case that supports the instrument. As compared to an instrument that measures the displacement of the inertial mass, it suffers from a loss of valuable information, as will be demonstrated in the examples that follow.
The VolksMeter is a horizontal seismograph [1] that employs a `simple' pendulum, whose motion is measured with a displacement, rather than a velocity sensor. Unlike velocity sensors, the only limitation to its response at low frequencies is the stability of the electronics employed. Its AD7745 capacitance to digital converter, that is used with a fully-differential, area-varying capacitive array- is stable enough for at least some earth motion studies whose characteristics require months-long observations.
It is the tilt response of the Mercer University two-channel instrument that is being exploited in the effort presently described. The isolated-from-building pier on which the VolksMeter sits is a monolithic aggregate-free concrete structure whose 18-in lower cylinder extends 20-ft into the ground. As such, diurnal thermoelastic tilts are much less significant than was true of a previous study which looked at a pendulum's motion almost continuously for more than a year.
Correlation Results
In each of the graphs that follow, the (approx.) N-S channel output is graphed versus the E-W channel output with data spanning a time interval of 24-h. Raw data were stored to the computer at a sample rate of 10 per s. Only every 600th value (effective rate of one per min) were used to generate a given plot. The units for all axis-values are capacitance to digital (24-bit) counts, with a calibration constant of 2×10⁹ counts/rad.

Figure 1. Correlation plots that demonstrate periodic strain
in the earth.
Strain Periodicity
In the time frame from 10 Feb to 14 Feb one sees from the Fig. 1 plots that the two channels go from (i) in-phase, to (ii) essentially quadrature, and back to (iii) in-phase. This process is impossible without strain cycling by some so-far-unknown mechanism. There is no way from the single instrument employed to determine what region (how much) of the earth is responsible for this behavior. Whatever the size of that region, it involves- at least sometimes - a `release' from the resulting energy build-up by means of a bistable compensation, as shown in Fig. 2.
Bistability-a means for strain energy release
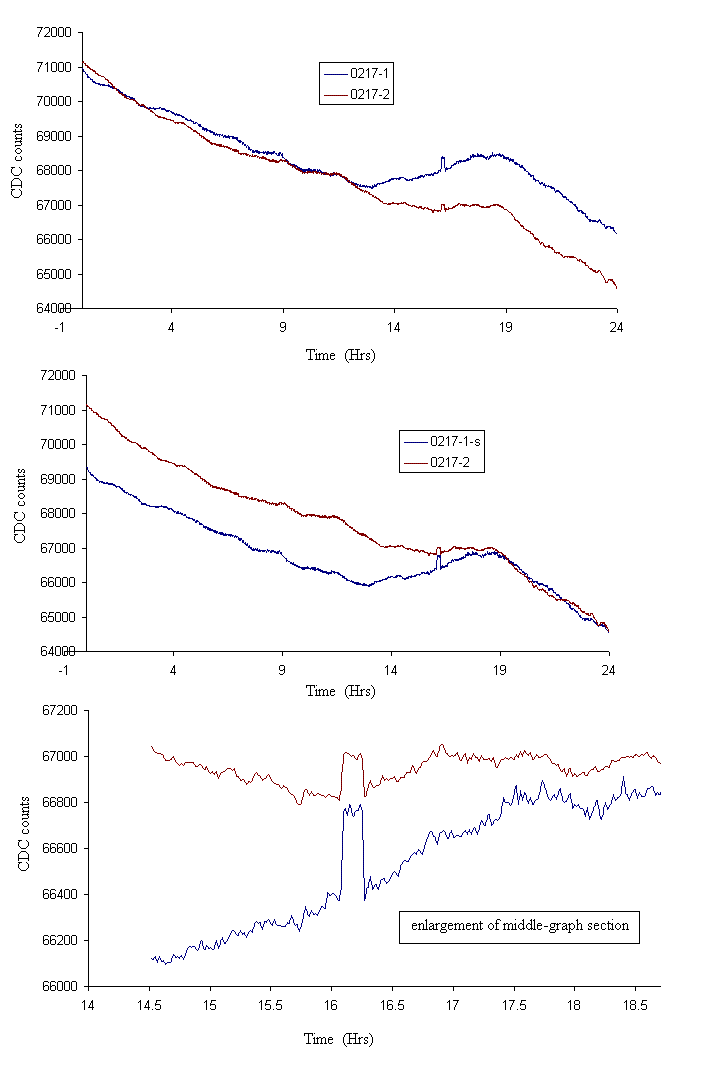
Shown in Fig. 2 are time plots in which channels 1 and 2 are in-phase at the start of the 24-h record beginning 00:00 UTC, 17 Feb 08. To emphasize the phase relations, an adjustable dc offset has been used with channel 1 (E-W). In the top graph, the offset has placed the two channels close together for the first 12 to 13 hours. Thereafter, the phase of the two channels diverges for a while, with a disruption that involves the bistable pulses seen in both records. In a few hours following the pulses, it is seen from the middle graph that a near in-phase relationship has been restored (using a different offset).
The enlargement of the bottom graph of Fig. 2 shows more clearly the simultaneity of occurrence of the pulses. Independence of the two pendulums and their electronics virtually assures that the bistability is not the result of instrument artifacts.

Figure 2. Illustration of the release of strain energy by means of
a bistable pulse.
Conclusions
Pulses of the type presently shown occur frequently in the output of the Mercer University VolksMeter. The author has observed similar bistabilities with other pendulum instruments that sat on less sophisticated `piers'.
It is postulated that these mostly unknown-to-the-seismic-world pulses are an important dynamic feature of the granular earth. They probably play an important role in the subduction processes responsible for earthquakes.
They have remained unstudied for the reason that rate-data sensors are very poorly suited to their observation. This is due to two factors. First of all, taking the derivative of a pulse results in two `spikes' that are much more likely to be viewed as irrelevant noise. Second, the inferior signal to noise ratio of velocity sensors at increasingly lower frequencies-means they are just not likely to be observed.
Bibliography
[1] Information concerning the VolksMeter can be found online at http://rllinstruments.com