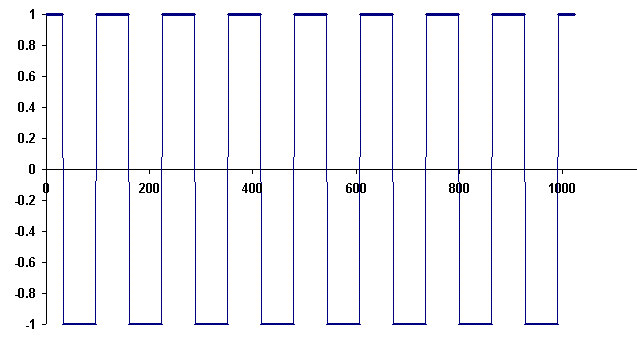
Figure 1. A square wave generated using Excel, for purpose of computing the FFT with Dataq's waveform browser.
Common commercial software packages are shown to be an excellent synergetic means for teaching spectral concepts using the Fast Fourier transform. These are (i) Dataq's free `waveform browser' and (ii) QuickBasic or Excel to simulate waveforms for analysis by the browser.
The Fourier series is fundamental to mathematics education for the sciences. Its extension to non-periodic waveforms, by means of the Fourier transform, is essential to technological applications. The removal of otherwise enormous, nonessential floating point calculations, is necessary for any practical implementation of the transform. The algorithm invented by Cooley and Tukey, known as the fast Fourier transform (FFT), does just this. It is the means whereby numerical calculation becomes efficient for large (meaningful) sample sizes of digitized data. Without such efficiency, important processes, such as magnetic resonance imaging, would not be feasible [1]. The FFT removes the huge degeneracy that occurs when one uses the discrete Fourier transform [2]
Visualizing phenomena in the frequency domain is not easy for the majority of individuals. Although many textbooks treat the Fourier series with its various properties; for example, what happens (such as the Gibbs effect) when truncated to a finite number of terms; the classical textbook approach to developing intuition is limited by its non-interactive nature.
Although the computer provides powerful means to enhance learning by interactive means, the interaction is of little practical value unless the software employed is both powerful and user friendly. The present author learned a great deal about the FFT by laboriously programming primitive computers using machine code. By this means was he able to understand the graphical properties of the algorithm[3]. Although this time-consuming exercise allowed him to develop an appreciation for how the tool functions, it provided little understanding about what gets generated by an FFT.
Intuitive appreciation for properties of the frequency domain result (at least for most) only after looking at the transforms of many different temporal waveforms. This can only be reasonably accomplished when both (i) the waveform generator and (ii) the transform analyzer of those waveforms can be easily managed. To this point in time, there is no software package known to this author which combines both of the above-stated properties in a single powerful and user-friendly package. Algorithms produced by Microsoft are an excellent means to simulate various waveforms. To take the FFT of one of the waveforms so generated can be accomplished with both Quick (or Visual) Basic, and also Excel. This author has in the past written various programs in Quickbasic that do this, based on information in Press et al.[4]. He continues to use some of these codes nearly two decades later. It is also possible to calculate the FFT in Excel; as demonstrated by the article dealing with Gaussian filters[5]. Neither Quickbasic nor Excel is well-suited by itself to exercises concerned with FFT pedagogy. On the other hand,when combined with a freeware browser from Dataq Instruments, Dayton, Ohio[6]; either one of them becomes part of a powerful tool. The synergetic use of the pair is illustrated in the examples that follow.
Shown in Fig.1 is a square wave that was generated easily with Excel.

Figure 1. A square wave generated using Excel, for purpose of computing
the FFT with Dataq's waveform browser.
First a `time' column in `A' was produced by putting a zero in A1. Then in A2 was typed `=A1+1'. Autofilling downward to row 1024 was accomplished by highlighting the lower right corner of A2 with the left mouse button and dragging to the last row as the button was held down.
To generate the square wave, first a cosine wave was generated in the C column by typing at c1024 the following: `=cos(6.2832*A1024/128)'; then autofilling upward. To avoid autofilling with a dastardly positive Lyopunov exponent, always do so upward when possible (toward the rigid row 1).
Finally the square wave was produced by going to B1024 and typing `=sign(c1024)' and autofilling upward.
Importation to the powerful WWB software is easily managed by first saving the Excel generated square wave in column B as an ascii file. To do this one clicks with the mouse button the `B' at the top (header) to highlight all 1024 values in the column. Then an edit `copy' is done, so that the data can be pasted into `Notepad'. Once in Notepad, the data is then saved as a `txt' file, for present discussion named square.txt.
To input square.txt into the WWB browser, one uses the Dataq executable `windaq32'. (A shortcut to this executable can be conveniently placed on the desktop after installing on one's computer the download from the Dataq website.) One opens the file by double clicking on item 15 (Spreadsheet print file (ASCII) with fixed scale). This displays a DOS window in which the first thing to be entered is the sample rate (1 for square.txt). It should be noted that this package derives from software that was developed by Dataq for viewing files generated with their analog to digital (hardware) converters. The browser can be used to input virtually any file with an ascii format. The first step just mentioned converts the ascii to Dataq's *.wdq format.
The second step is to input the voltage range of the data (for square.txt in the examples which follow, this was set at +/- 2 V). Following this step, the Windaq browser opens to permit the multitude of simple, icon-driven operations with which one can readily study this square wave in the frequency domain.
Shown in Fig.2 is the FFT of square.txt, calculated with the Hanning-window
option, using the full 1024 points of the record.
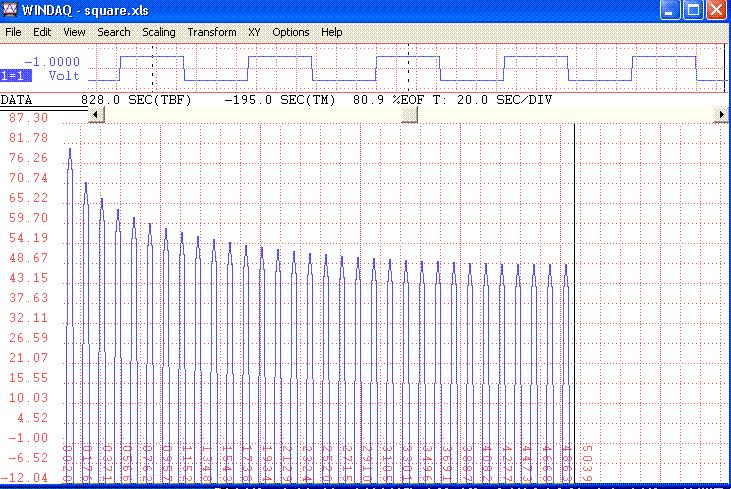
Figure 2. Spectrum of the square wave of Fig. 1, computed using Dataq's
WWB browser.
As known to students of Fourier series, the square wave contains odd harmonics.
It is interesting to look at how close an approximation is to be realized
by looking at a finite number of these odd harmonics. Illustrated in Fig.
3 is the manner in which the approximation increases as the number of harmonics
included goes from fundamental-only out to truncation following the fifth
harmonic. 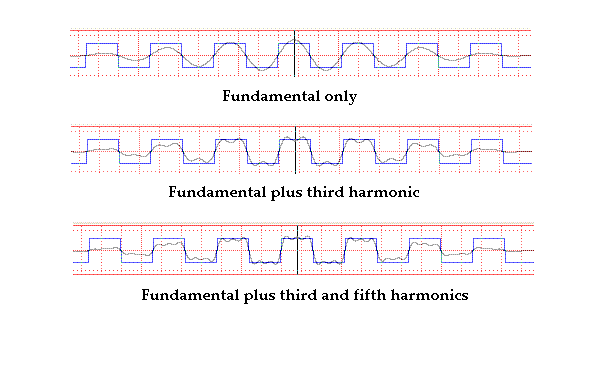
Figure 3. Illustration of `goodness of fit' according to the number
of odd-harmonics retained in the Fourier series representation of the square
wave.
It can be seen that the fit `deteriotes' either side of center, which results through use of the Hanning window. Hanning apodization is one in which (before taking the FFT) a record is first multiplied by a `cosine' weighting function, which goes to zero at the end-points of the record. This is used to prevent `runaway' low frequency contributions and other troublesome features of `mismatch' due to differences in the start and stop values of the record. Otherwise, any secular trend and mean position offset in the record must be removed numerically before computing the FFT.
To generate any one of the cases shown in Fig. 3, it was only necessary to operate on the spectrum of Fig. 2 as follows: Place the cursor at the frequency position for which truncation is to occur. Then go to the `Transform' menu and drop down to the `low-pass filter' option. Click on this case to cut off everything above the chosen value. Now go back to the transform menu and drop down to the `inverse transform' and click on it. For Fig. 3 the `view' option was `format screen'= `two waveforms,overlapped'.
Shown in Fig. 4 is what happens when everything below the 9th harmonic of
the square wave is cutoff.

Figure 4. Illustration of edge-enhancement by means of high-pass
filtering.
Many other cases of interest to students can be easily studied in similar
manner. For example, one form of a triangular wave can be readily generated
in Excel as follows: Generate a time column in A as described before. Then
in column B1024 use `= mod(A1024,128)/64-1' and autofill upward to complete
the B column. Copy and paste to Notepad, and then open in the WWB browser.
After doing an FFT and low-pass filtering to retain only the lowest three
spectral lines, one obtains Fig. 5.

Figure 5. Approximation to a triangular wave by retaining only the
fundamental and the 2nd and 3rd harmonics.
Heisenberg uncertainty principle
This famous uncertainty principle derives from the properties of a Gaussian;
i.e., the Fourier transform of a Gaussian is itself a Gaussian. And as the
width of a Gaussian increases in one domain, there is a decrease in width
of the conjugate Gaussian in the reciprocal domain. This is illustrated in
Fig. 6; the Gaussian was generated with Excel and the ascii code was copied
into Notepad, from which it was imported to the Dataq browser for analysis.
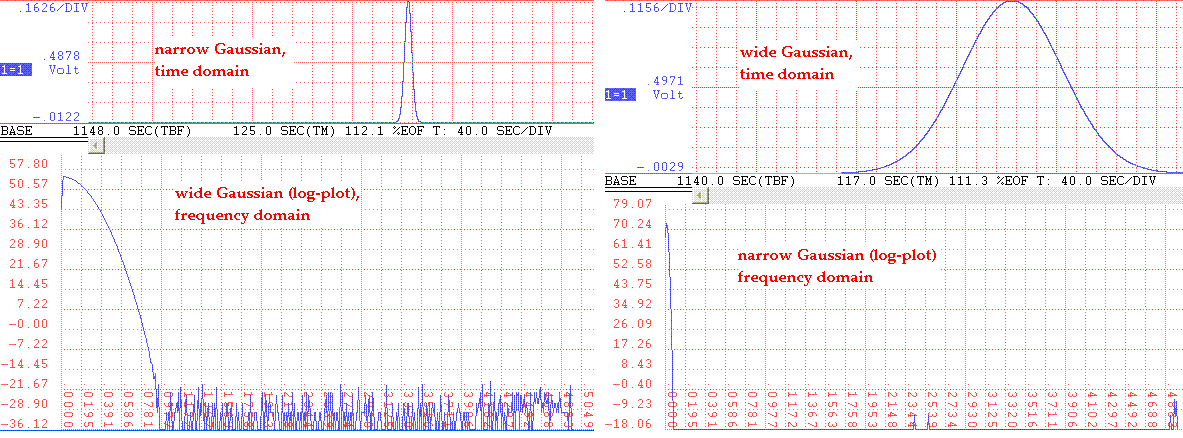
Figure 6. Illustration of the essential property of the Heisenberg
uncertainty principle; i.e., the product of the width in (i) the time domain
and (ii) that of the frequency domain is a constant.
The preceding figures correspond to cases that can be treated analytically.
The work required for meaningful appreciation of the frequency domain by
analytic means is orders of magnitude greater than the numerical techniques
presently described. These numerical techniques are not limited to
textbook-simple systems. Fig. 7 shows data that was generated with code that
simulates a pendulum having similarities to one form of the Duffing
oscillator[7].
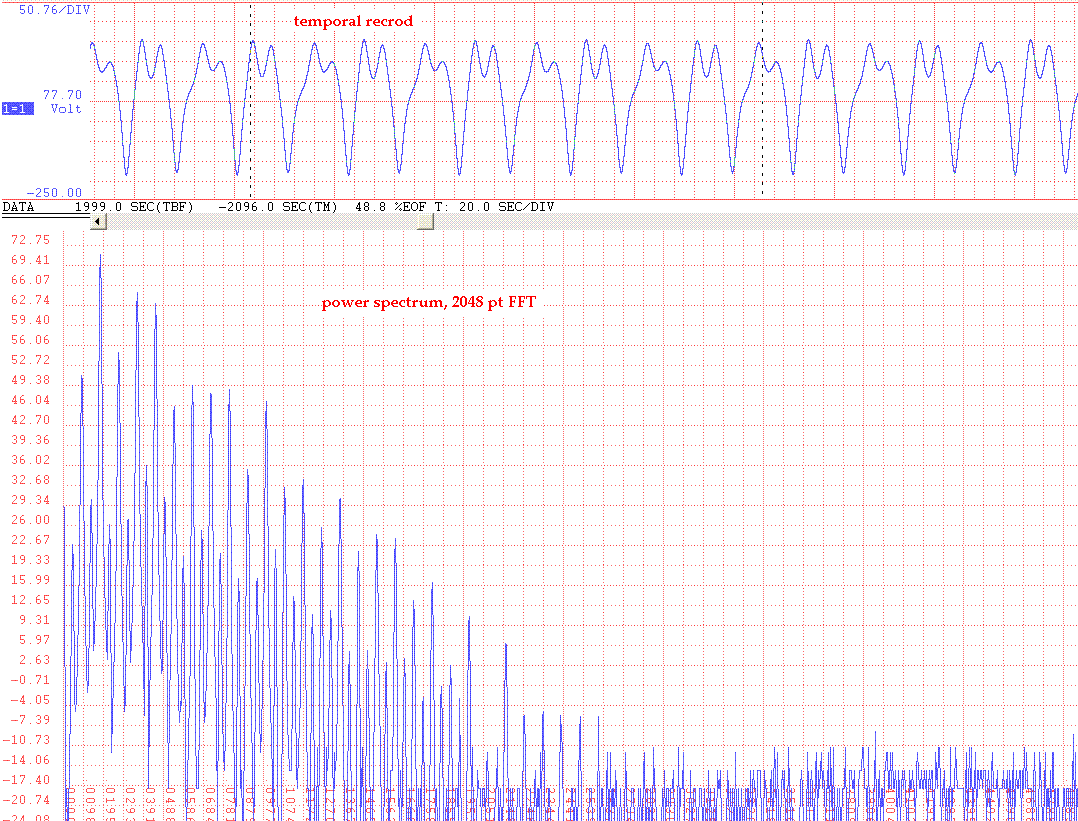
Figure 7. Example of the power of the present methods when used to
study sophisticated systems.
The case that was selected involves chaotic motion. The ascii output from the program[8] was generated by an executable derived from code written in quickbasic more than a decade ago. The chaotic pendulum mentioned in [8] is no longer commercially available; however, one of the instruments has been placed online at http://physics.mercer.edu/PENDULUM/.
The use of ascii formatted data with Dataq's free waveform browser constitutes a powerful analysis tool. The cases shown in this article feature only a small number of the many options available to the user of this browser. Lest the reader believe that these claims are exaggerated, consider the fact that this article was composed in its entirety (data-generated files converted to gif's for webpublishing, plus writing of the prose) in a total time less than five hours.
It is worth noting that this author has no relatonship, financial or otherwise, with Dataq Inc. He is an admirer of their sophisticated software, that has been used for research as well as pedagogical purposes[9].