Precursor Warnings of Structural Catastrophe through
Precursor Warnings of Structural Catastrophe through
observation of
a Seismic `Bounce'
Randall D. Peters
Physics Department, Mercer University
Macon, Georgia
Copyright August 2007
Abstract
Novel technology employing two synergetic tools, one hardware and the
other software,
provide clear evidence
for the possibility of
preventing fatalities due to the collapse of structures.
1 Background
1.1 Events
Two August 2007 disasters in the United States prompted the
generation of this
article; they were the collapse of (i) the Minneapolis interstate
highway bridge,
and (ii) the Utah coal mine.
1.2 Relevant Science
Plenty of scientific knowledge is poised to address the challenges
of predicting catastrophes of mechanical type. The main problem with the
relevant database is that useful information has been
distributed piece-meal
among several disjointed scientific specialties. For example, the
Portevin Le Chatelier
effect, which was discovered in the early 20th century by French
physicists [1], is virtually unknown to the physics community, even though
materials scientists and engineers have studied the PLC effect
for decades. This effect is one in which the strain of an alloy
does not change continuously as increasing stress is applied to the
specimen; rather, the strain exhibits `jerky' behaviour because of
discontinous (catastrophic) alterations of state. Similar jerky
behavior is well known to (early generation) electrical engineers
familiar with the Barkhausen effect of magnetic materials.
Catastrophe theory is relevant to the hypothesis here presented, as
noted by the following quote from the abstract of reference [2]:
``...extra responses are called ``catastrophes.'' This kind of behavior is
summarized by the phrase `` ...the straw that broke the camel's back.''
Situations in which a gradually increasing force leads to a gradually
increasing response, followed by a sudden catastrophic jump to
a qualitatively different state, are all too common. They are seen,
for example, iin the collapse of a bridge, ....''
Unfortunately, the `catastrophe functions' used by mathematical physicists
to describe changes that disobey the fundamental theorem of calculus
are esoteric and understandable by only a select few.
One might expect seismologists to be the key-holders of instrumentation
to provide a solution to the prediction conundrum, since
precursor `bounces' are expected to dominate the signature of
incipient failure. Unfortunately, as explained in the material that
follows, conventional seismometers are
not well suited to the detection of these events. Moreover, probably
a majority of seismologists view the matter of earthquake prediction
as hopelessly complex.
NOTE: The term `bounce' was used by Utah miners to describe
tremors they felt during work-shift periods that preceded the 8 August
collapse that trapped their coworkers. In the material that follows,
other examples of ground `bounce' is provided. These cases involve
ground accelerations of localized type, studied with unconventional
tools invented by the author. These comprise: (i) a novel hardware
approach to measuring the displacement of the mass of a seismometer
and (ii) a new
software tool of digital data processing type-the seismic
Cumulative Spectral
Power (CSP).
2 Hardware
Unconventional seismometers developed by the author
in a period spanning more than a decade were made possible by his
invention of the
first fully differential capacitive sensor [3]. Similar hardware
has already made a significant technological impact on the
electronics world [4].
2.1 Analog instruments
The SDC sensors
have been used in a variety of seismic instruments.
For example, one of the most common of the commercial
seismometers used in the WWSSN [5] of a past generation-was modified
by replacing the original Faraday law (magnet/coil) detector with
an SDC sensor.
This modified Sprengnether vertical instrument was made to function
according to a `soft-force-feedback', accomplished by means of a
long-time-constant integrator (SDC output into an opamp)
feeding the original magnet/coil
subsystem now acting as an actuator instead of a sensor as orginally
configured. This soft-force architecture differs radically from
that of `force-balance' used in commercial instruments.
For frequencies below the instrument's eigenfrequency (but larger
than the reciprocal of the integrator's time constant of about 3000 s), the
output from the instrument is proportional to ground acceleration;
whereas the output from commercial instruments is proportional
to the derivative of ground acceleration (the `jerk').
Insistance
on the use of a `velocity' sensor (jerk case) as opposed to a
displacement sensor (acceleration case), is responsible for a
serious degredation
in the low frequency signal to noise ratio. This is easily understood
from a consideration of velocity being the derivative of displacement.
The derivative `pulls-out' frequency as a multiplicative term through
the chain-rule of calculus. As the frequency decreases toward zero
in progressing toward the spectral region of
importance to `bounce' dectection, the multiplier term causes the
instrumental self noise (such as the part due to electronics) to become
larger than the low frequency signal one wishes to observe.
In the case of `step' changes or bistable `pulses' shown in the material
that follows, the effect of differentiation is to cause these precursors
to become less obvious and to be easily confused with electronics artifacts.
In addition to the modified Sprengnether, the author has performed
numerous experiments with a novel tiltmeter [6]. It also uses SDC
sensing in the form of an array for improved sensitivity.
2.2 Digital Instrument
Whereas the modified Sprengnether uses digital electronics involving
synchronous detection, a commercial instrument developed by
the author and
two business partners is the first fully-digital seismograph.
The sensor electronics of other commercial instruments remains analog,
similar to that of
the modified Sprengnether, except using only a
singly-differential, as opposed to fully-differential capacitive sensor.
The VolksMeter uses
fully-digital electronics along with fully-differential capacitive
sensing.
The instrument was built around the award winning `capacitance to digital
converter' integrated circuit developed by Analog Devices [8].
3 Examples
An example of seismic bounce (bistability)
is illustrated in
Fig. 1. The pulses seen in
the trace
resulted from instability of the soil supporting the pier
on which the instrument was placed. This soil was not properly
compacted when supplied as backfill to the region; and similar bounces of
greater intensity and frequency were noted
during jackhammer activity when workers replaced a nearby concrete sidewalk.
The pulses are easily
observed in the output from the author's tiltmeter, because of the
excellent low frequency capability of the instrument. Such
pulses would be less obvious if the trace were generated from
the derivative of rotor position.
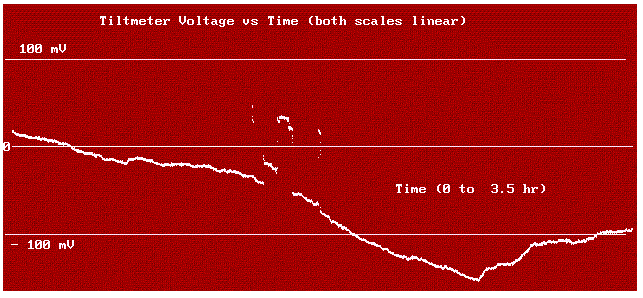
Figure 1. Pulses of bistability (`bounce') due to soil instability.
The output voltage from the tiltmeter is proportional to rotor position.
The record also shows features of diurnal secular change in mean
position due to thermo-elasticity. Its influence can be removed by
placing the instrument several meters underground.
At least some earthquakes are also preceded by seismic `bounces'. Evidence
for this claim is provided in Figure 2.
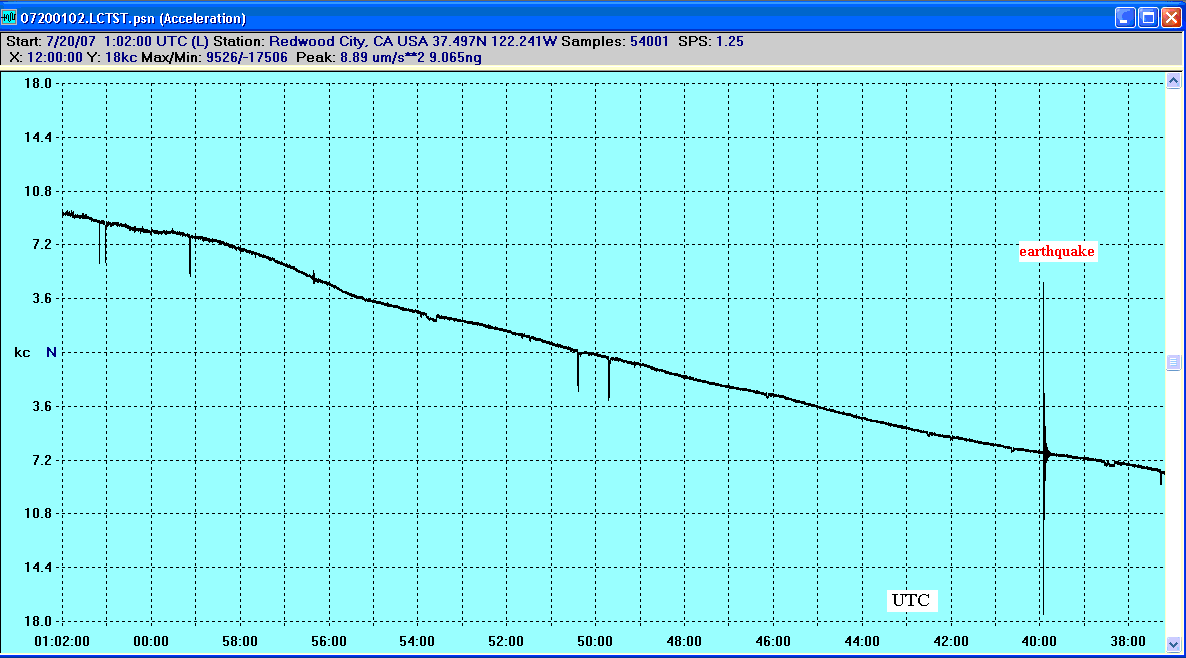
Figure 2. Pulses observed before the earthquake of 20 July 2007
near Oakland CA, by a VolksMeter seismograph situated in Redwood City, CA.
In this 12-h total duration record,
the first pulse occurs more than 10 hours before the Mw 4.2 earthquake.
The probability that pulses of this type can be seen is evidently
determined by (i) magnitude of the earthquake,
and (ii) its proximity to the seismometer (assuming the use
of an instrement with d.c. capability).
Even close events are not
readily detected by conventional sensing methods, as can be inferred
from fig. 3.
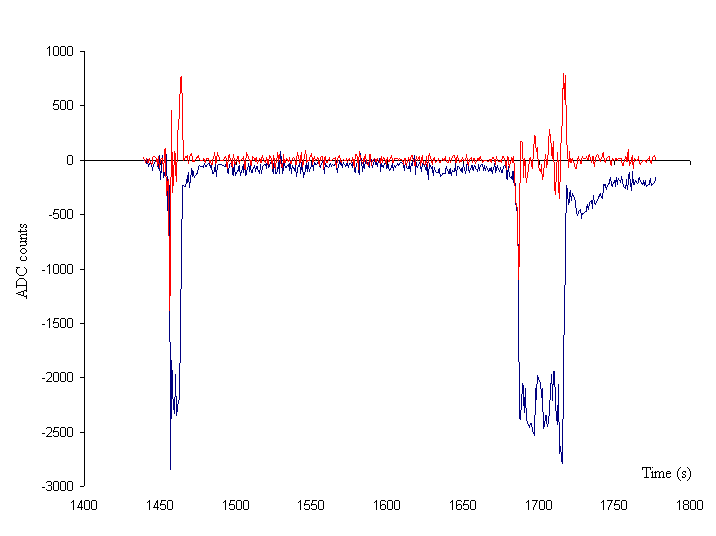
Figure 3. Close-up of a portion of Fig. 2 showing the first two
pulses (blue, shown with an offset). The derivative of the record,
generated numerically and
shown in red, contains reduced information concerning the pulses
while at the same
time is more noisy.
The red curve is representative of what would have
been observed with a conventional seismometer, as opposed to the
VolksMeter. The pulse-edge `spikes' are much more likely to be
interpreted as electronics artifacts.
4 Frequency Domain Analysis
For all of the preceding figures, the information presented is in the
time domain.
As is well known to the physics community, data from the frequency
domain is frequently the more useful of the two. By this means,
for example, seismologists concluded that the Utah
mine disaster was not triggered by an earthquake. Rather, the
spectral signature of the earth's vibrations measuring magnitude 4 on some
nearby seismometers were consistent with
a mine collapse independent of an earthquake.
The traditional tool with which to represent frequency domain data is
either (i) the Fourier transform spectrum based on the FFT (Cooley
Tukey algorithm), or (ii) the power
spectral density (PSD). An FFT spectrum generated by two different seismometers
will not be the same unless the instruments are identical, since
the transfer function of an instrument (unique to that
instrument) influences its output.
Influence of the transfer function is removed during
generation of the PSD; so
it is superior, especially if one
attempts to make absolute, as opposed to relative, sense of the data
presented. Unfortunately, most spectra of PSD type generated by
seismologists, appears to be limited to graphs used to evaluate
instrument performance-as opposed to trying to analyze earth motions.
One of the difficulties with most real-world PSD's, as opposed to a case
resulting from a highly
monochromatic disturbance-is that they are inherently
very noisy. The author
has recently developed a means for dramatically reducing the spectral
noise, by doing an integral over frequency of the PSD. The resulting
curve is referred to as the Cumulative Spectral Power (CSP) [9]. The
difference between the PSD and the CSP is similar to the difference
between a probability density function and its cumulative probability
equivalent. The cumulative function is obtained from the density
function by integration (or
conversely, the density is the derivative of the cumulative). Because
integration is inherently a smoothing operation for random
noise, the cumulative functions possess a significant advantage.
Shown in Fig. 4 is a series of both time records (upper graph-set)
and their associated
CSP's (lower graph-set). These correspond to 12-hour records collected not
only on the day of
the Oakland earthquake (red curve), but also (top graphs)
each of the four days
preceding that
event. The start time per record was the same for each of the five
days, and for the sake of clarity in the
representation, the temporal plots (upper graph-set)
have been shifted in mean postion from one another by 3000 adc counts.
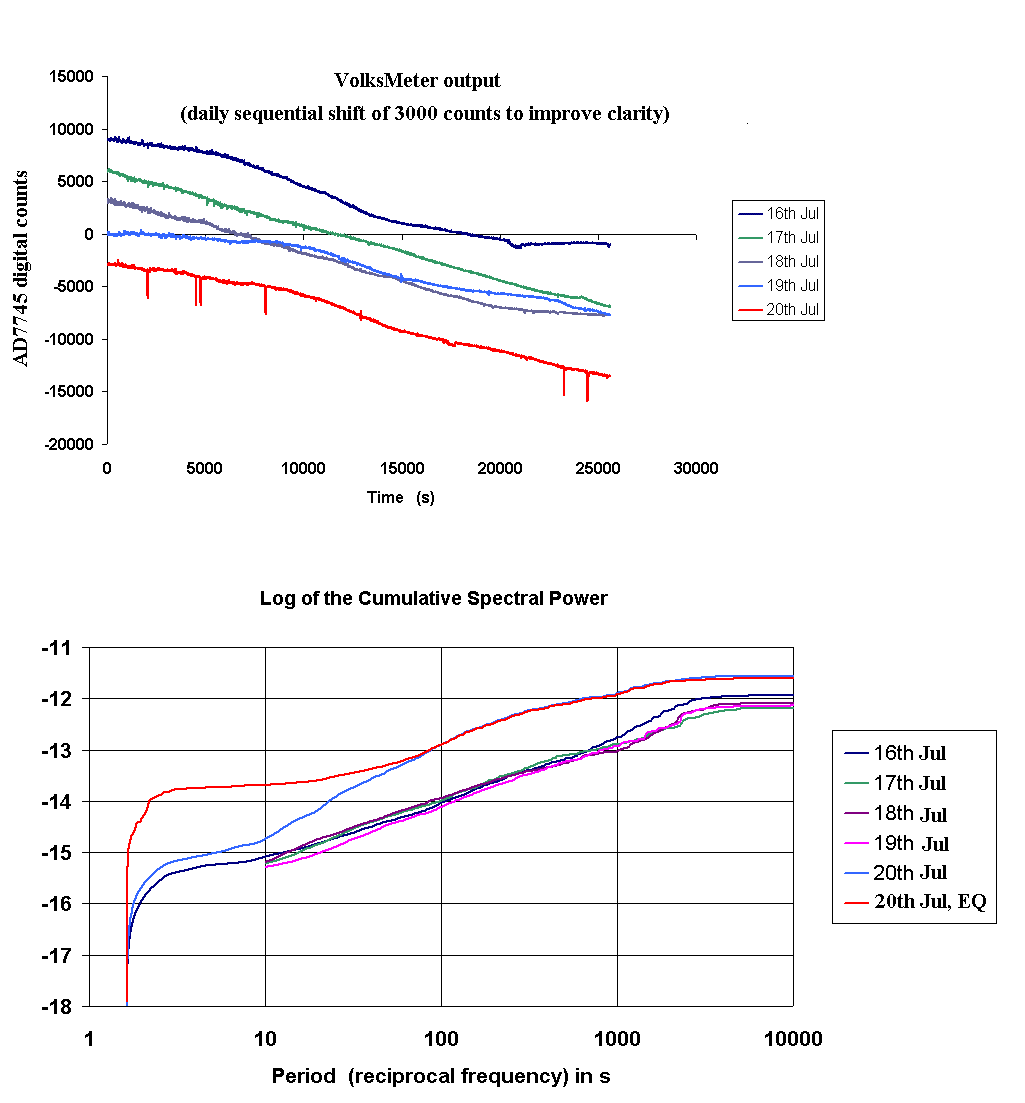
figure 4. Precursor information concerning the Oakland earthquake,
presented in the time domain (upper graphs), and also the frequency
domain (lower graphs) by means of the Cumulative Spectral Power.
The lower graph set shows six curves rather than five, to illustrate
the energy buildup that occurred (blue curve, mainly at low frequencies)
starting about 10 hours before the earthquake, due to pulse precursors.
It is worth observing that the blue curve increases
monotonically, which would
not be the case for just any distribution-in-time of the half-dozen
distinctly visible pulses in the upper graph red curve.
5 Conclusion
Suppose that hardware improvements of the type here mentioned have
the potential to improve our
knowledge of earth dynamics by two-fold. Further suppose that
advantages of software improvement (CSP over PSD) constitute another
two-fold increase. It is possible then, that the synergetic use of
the two could amount to an order of magnitude improvement in predicting
catastrophes in both the earth and in man-made structures. Only through
testing with a significantly larger number of
instruments can the hypothesis of this
article be tested; i.e., that lives could be saved through observation
of precursors to catastrophe.
Bibliography
[1] A. Portevin & M. Le Chatelier, 1923:
``Tensile tests of alloys undergoing transformation'', Comptes
Rendus acad. Sci. 176, 507.
[2] R. Gilmore, ``Catastrophe theory: What it is-Why it exists-How it
works'', AIP Conf. Proc-June 20, 1996-Vol 376, pp. 35-53,
Intro. to chaos and the changing nature of science and medicine.
[3] Symmetric Differential Capacitance (SDC) Transducer
employing cross coupled conductive plates
to form equipotential pairs'', U.S. Patent 5,461,319 (1995).
The SDC variant is related topologically to the first
fully differential capacitive sensor, also invented by the
author; i.e., ``Linear rotary differential
capacitance transduer'', U.S. Patent 5,038,875.
[4] Jim Karki, ``Fully differential amplifiers''
Texas Instruments Application Note, Literature
Number SLOA054B (2001)
[5] World wide standardized seismographic network. The Sprengnether
instrument here mentioned uses a LaCoste spring, whose internal
friction damping characteristics were first studied extensively by
Gunar Streckeisen as a graduate student. Streckeisen is the builder
of the `crown jewel' STS-1 seismograph, along with other STS instruments.
[6] Information on the tiltmeter is at
www.iris.edu/stations/seisWorkshop04/PDF/NOVELTILTMETER.pdf
[7] A description of the VolksMeter is provided at
http://rllinstruments.com . Some backgraound and characteristics are
to be found at
http://seismicnet.com/Volksmeter/State-of-the-art_Digital_Seismograph.pdf
[8] The spec sheet for the AD7745 is at
http://www.analog.com/en/prod/0,2877,AD7745,00.html
[9] R. Peters, ``A New Tool for Seismology-the Cumulative Spectral
Power'', online at http://faculty.mercer.edu/peters_rd/CSP/cumulative.html
File translated from TEX by TTH, version 1.95.
On 11 Aug 2007, 15:11.