Goals:
Assignments:
Review:
Mass Balance Equation for Solid Waste Systems
Generated Waste = Disposed Waste + Recycled Waste + Diverted Waste
Materials Flow Methodology
Site Specific Studies (aka - Load Count Analysis)
Think: What are the pros and cons associated with each of these methods of quantifying waste generation?
Exercise:
- Review THIS EXAMPLE PROBLEM
- Now, Rework THE EXAMPLE PROBLEM and include the following information:
- A recycling facility was also monitored. This facility received 12 loads during the survey which weighted 1,420 lbs on average.
- The local wastewater treatment facility estimates that 7,350 lbs of food waste is disposed of in home food grinders every week.
- In addition to calculating the per capita generation rate, calculate the recycling effecieny for this residential area.
- You should get a generation rate of 4.03 lb/capita/day and a recycling efficiency of 14.4%
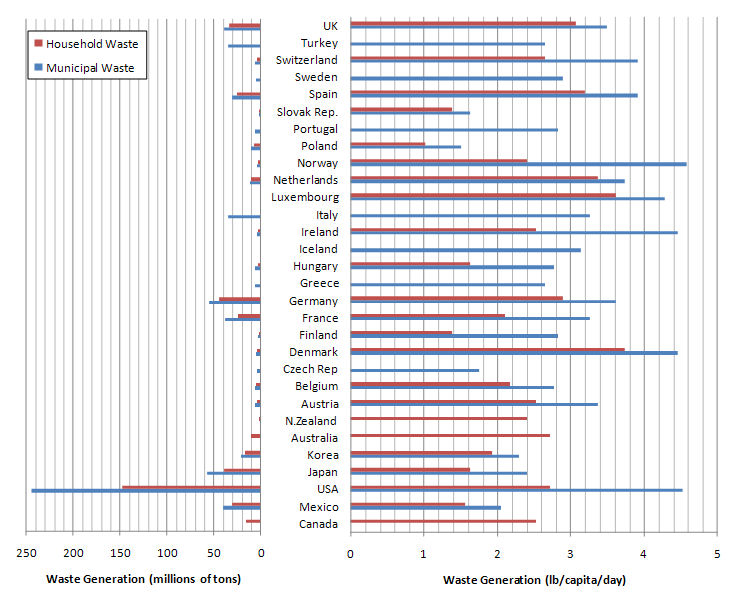
Data from Organization for Economic Co-operation and Development (OECD) Environmental Data Compendium
Report available at <http://www.oecd.org/document/49/0,3343,en_2825_495628_39011377_1_1_1_1,00.html>
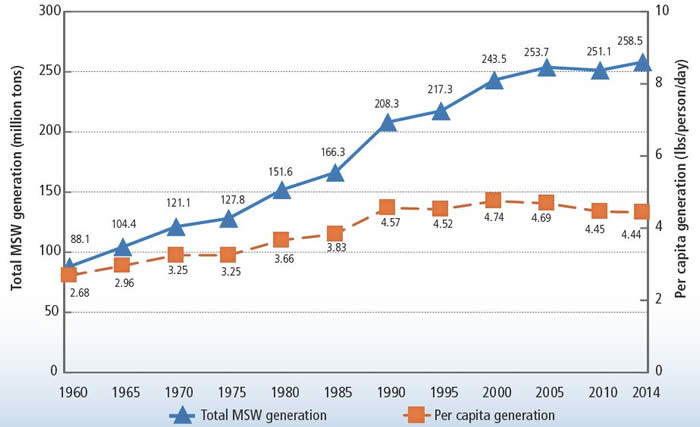
U.S. GENERATION RATES
Source: US EPA Advancing Sustainable Materials Management: 2014 Fact Sheet Assessing Trends in Material Generation, Recycling, Composting, Combustion with Energy Recovery and Landfilling in the United States November 2016
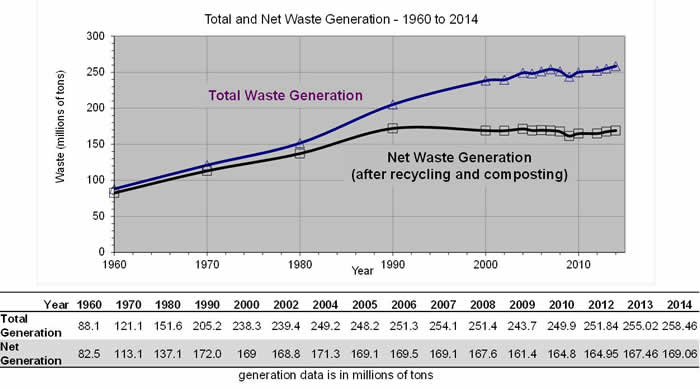
Note that the net generation rate shown is the amount of waste disposed to a landfill or WTE facility.
Data from: US EPA Advancing Sustainable Materials Management: 2014 Fact Sheet Assessing Trends in Material Generation, Recycling, Composting, Combustion with Energy Recovery and Landfilling in the United States November 2016